Totogi Charging-as-a-service
Product updates
Built-in Lightweight Policy Management ⚖️
Totogi now supports Built-in Lightweight Policy Management as a new module inside CaaS, evolving the platform from an OCS/CHF into a converged Charging + Policy solution. Operators now have the option of implementing high-impact policy rules directly within CaaS, with policy behavior configured in Plan Design without dependence on an external PCF/PCRF.
What’s included
– Built-in Lightweight Policy Management provides 3GPP-compliant policy control capabilities inside CaaS, delivered as a multi-tenant module:
– Native 5G policy control (PCF): Future-proof control over Service-Based Interfaces (HTTP/2 + JSON) for standalone 5G architectures.
– 4G policy control (PCRF): Full LTE policy control via an included Diameter adapter
– Roaming support (home/visited policy scenarios)
Supported interfaces
– 5G (SBI) -> Npcf_SMPolicyControl (PCF–SMF): session policy control
– 4G (Diameter) -> Gx (PCRF–PCEF) via the built-in Diameter adapter
Key features
⚙️ Session-level QoS negotiation: Supports default session QoS confirmation or downgrade at session establishment based on policy/plan constraints. Policies can be updated in response to events such as congestion, threshold crossing, and subscriber/profile changes.
🔄 Dynamic policy updates (event-driven): Dynamically align network resources with business rules. The system automatically confirms or optimizes session QoS based on plan constraints and can trigger real-time updates in response to network congestion or subscriber profile shifts.
🔀 Policy + charging alignment: Policy decisions can be driven by quota/spending limit triggers. The policy module is integrated with CHF using an internal N28-like interface, with charging counters behaving as if the PCF were integrated via N28.
🔔 Policy Event Exposure: Gain deep network visibility by exposing critical policy events to external analytics and management systems.
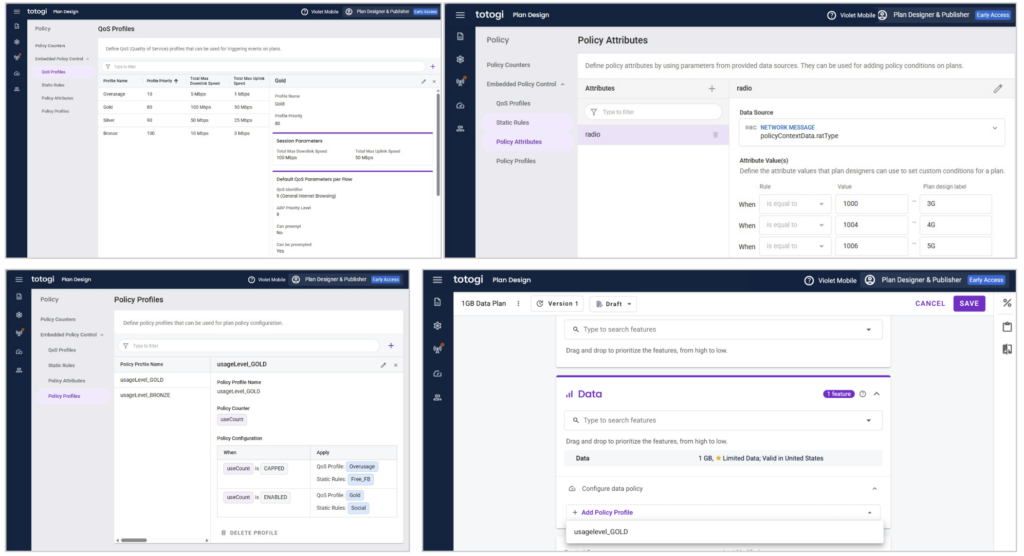
🛠️Configured in Plan Design: Policy rules are fully configurable in Plan Design, allowing your team to launch new services and iterate on plans without requiring product changes or technical overhauls.
Impact for existing customers
Existing customers that want to adopt Built-in Lightweight Policy Management will need to:
– configure Policy in Plan Design: Quickly define your logic in Plan Design and connect to your existing network interfaces (Npcf/Gx).
– integrate relevant network interfaces (5G: Npcf /4G: Gx)
There is no expected downtime when enabling the module.
What’s coming next
- Dynamic PCC rules
- Rx interface support (as part of the Voice over IMS enablement)
🔓 Early Access
The Built-in Lightweight Policy Management is currently available through an Early Access environment. Please contact Totogi Support to request access.
⚡ Rate Anything: Faster Plan Innovation and Greater Charging Flexibility
Totogi is introducing Rate Anything, a new rating framework in CaaS that gives operators far greater flexibility in how services are charged. With Rate Anything, plan designers can define charging logic using any attribute available during a request — including subscriber information, balances, counters, lifecycle state, and network message fields.
This allows operators to design plans that more closely match real business and network conditions. All of this is configured directly in Plan Design through an intuitive visual interface, enabling business teams to design and launch sophisticated plans without requiring engineering or IT development.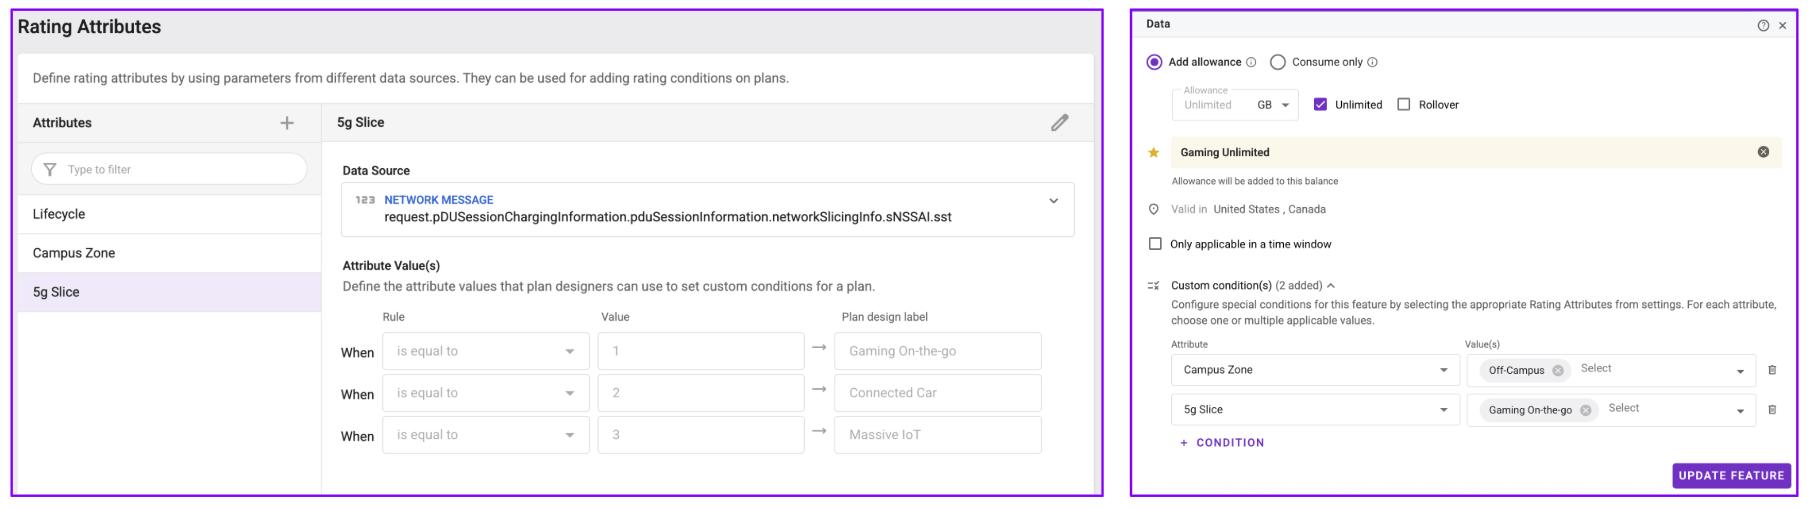
🚀 Launch new plan ideas faster
Create new offers without waiting for new rating parameters, engineering changes, or template updates.
⚙️ Support more sophisticated services
Design plans that evaluate multiple custom conditions — such as subscriber state, service type, network context, or balance state — within a single configuration.
🔍 Examples of new possibilities
Rate Anything enables operators to create plans that:
✔️ Rate traffic differently based on subscriber lifecycle state
✔️ Use “any” network message fields to determine pricing
✔️ Configure new services using custom rating groups, fully supported through Plan Design’s intuitive UI
✔️Use subscriber usage counters as rating attributes to apply different rates or service behavior
These capabilities give operators greater flexibility to create differentiated services and respond faster to market opportunities.
🔓 Early Access
Rate Anything is currently available through an Early Access environment, allowing customers to begin designing Rate Anything plans and preparing configurations ahead of broader rollout. Please contact Totogi Supportto request access.
📊 Integrated Dashboard Now Available in Plan Design!
Get quick access to key Business and Operational insights—directly inside the UI. Assign the Analytics role to users who need access, and they can view KPIs and charts with just one click.
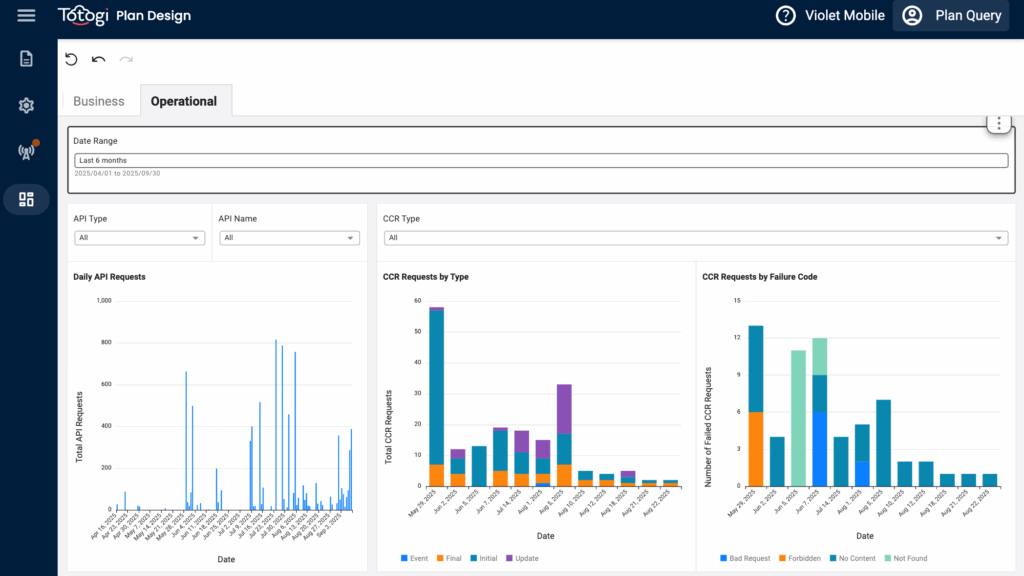
Plan Design now includes a Dashboard that brings together business KPIs and operational metrics in one place. With separate Business and Operational views, you can track account growth, subscription activity, API usage, and charging request behavior—without leaving Plan Design.
📌 What’s Included
This first release introduces a foundational set of KPIs and charts. And it’s only the beginning—future updates will expand these dashboards with additional metrics and 🤖 AI-powered natural language tools for creating and interacting with charts. These enhancements will be enabled automatically, with no manual upgrades required.
📈 Business Dashboard
KPIs:
✔️Accounts Added (Month to Date & Last Month)
Charts:
✔️ Daily Net Change in Accounts. ✔️ Daily Net Change in Plan Subscriptions
⚙️ Operational Dashboard
Charts:
✔️ Daily API Requests by Volume ✔️ CCR Requests by Type ✔️ CCR Requests by Failure Code
These dashboards help you monitor system usage, identify anomalies, and track business performance—no external tools required.
✨ Stay tuned—more KPIs, charts, and interactive features are on the way! 🚀
🔁 Subscriber Lifecycle Management Has Arrived!
Visually design how subscriber accounts move through different lifecycle states — and automate transitions based on expiry.
You can now define and manage subscriber lifecycles tailored to your business strategy ranging from simple to complex depending on how you segment, manage, and evolve your subscriber relationships. Use our graphical editor in Plan Design to create multiple lifecycles to support different subscriber types such as Prepaid, Postpaid, SME, or Large Enterprise, each with their own set of states and transitions. Assign lifecycles to accounts via API, and let the system handle transitions automatically when expiry is reached.
Key Highlights
✔️ Model lifecycles and transitions visually in Plan Design
✔️ Configure expiry logic per state
✔️ Assign and manage account lifecycles easily using APIs
✔️ Trigger transitions automatically on expiry
✔️ Refer to EDRs for complete lifecycle traceability
📍 Now available under Plan Design → Settings → Subscriber Lifecycle
📦 Customer DB Exports: Daily Customer Data in Your AWS Account
We are excited to introduce the Customer DB Exports feature, which gives you secure, automated daily access to your full customer and device data directly in your AWS account. Use this export to support reconciliation, revenue assurance, and business analytics, all queryable in Amazon Athena. 📊
Key Features:
🗂 Full Daily Export: Receive a complete daily snapshot of customer accounts, devices, provisioned plans, balance values, and more. Data reflects the state of your customer data as of midnight UTC.
🔐 Secure Cross-Account Delivery: You provide a Role ARN and target configuration (database, table, S3 folder); Totogi securely delivers your export to your AWS account.
⏳ Time-Travel Queries: Query current or historical versions of your customer data directly in Amazon Athena using standard SQL.
🔐 Single Sign-On (SSO) Support in Plan Design
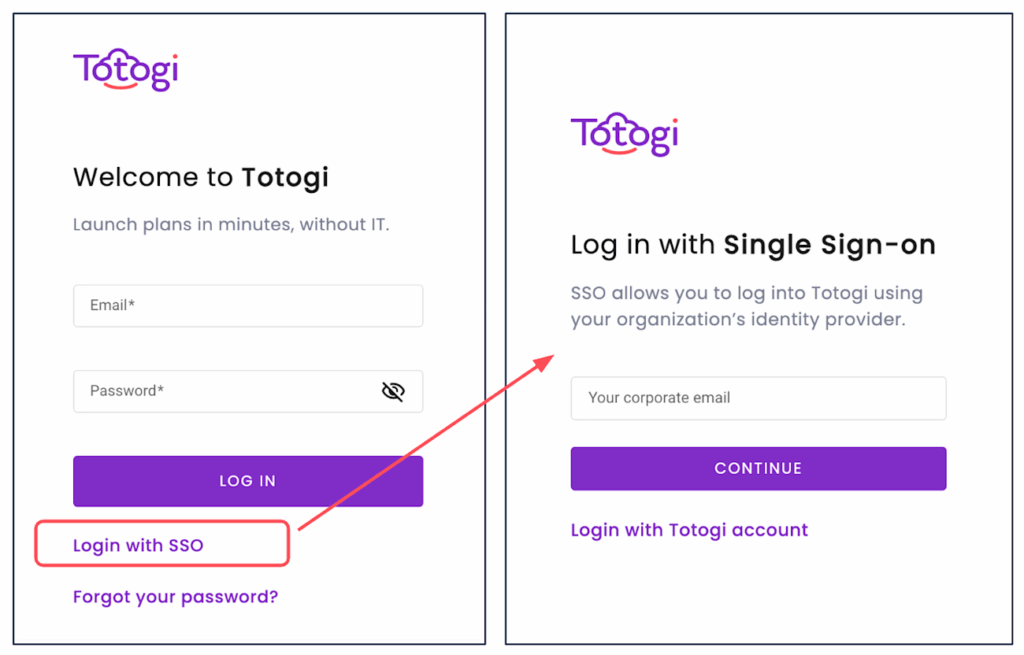
We are excited to announce the introduction of Single Sign-On (SSO) support, enabling companies to streamline user authentication through their existing SAML2-compliant Identity Providers (IdPs). This enhancement offers a seamless and secure login experience, aligning with enterprise security standards.
Key Features:
- Tenant-Specific SSO Configuration: Administrators can now configure SSO on a per-tenant basis, providing flexibility to integrate with your organization’s preferred IdP.
- Seamless Login Experience in Plan Design: The Plan Design interface now includes an SSO login option. Users can enter their corporate email and are seamlessly redirected to their IdP for authentication, simplifying the login process.
Getting Started:
SSO setup requires configuration per tenant. Please contact Totogi Support for further assitance on how to set up SSO for your tenant.
Multi-tenant SSO support is on the horizon, allowing users to authenticate across multiple tenants with a single login. Stay tuned for updates on this feature 🚀
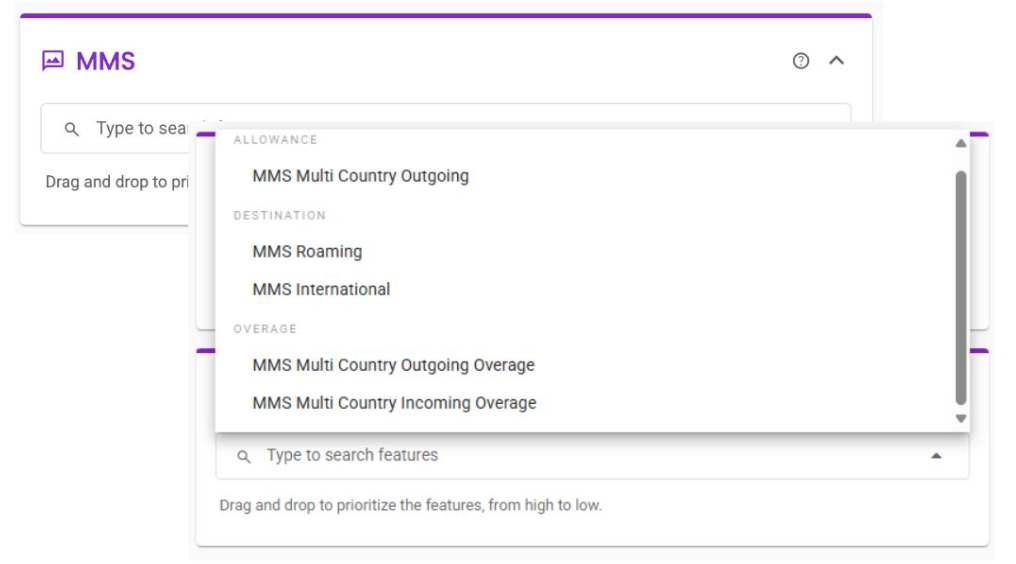
📨 MMS Rating Support for 4G and 5G
Totogi now offers precise MMS rating, enabling accurate billing for multimedia messages over 4G and 5G networks.
Totogi introduces MMS rating support, ensuring seamless event-based charging for multimedia messages while meeting 3GPP requirements. This enhancement includes:
✅ Accurate rating for MMS sent over 4G and 5G networks.
📄 Full support for 3GPP-compliant MMS-Information AVP fields.
With this update, Totogi ensures that subscribers are correctly billed for sharing photos, videos, and other multimedia content, while maintaining compatibility with 3GPP standards.
⚠️ Important: In order to fully support MMS rating, a field mapping has to be configured; MMS originator and recipient addresses shall be mapped to IMS called party and IMS calling party addresses. 📩 Please contact Totogi Support to learn more about configuring MMS related field mapping for your tenant.
Happy CaaSmas: Wrapping Up a Year of Totogi Magic!
🎁 400+ gifts delivered, 🎄 18-day miracle, and 🚀 new presents under the tree—Totogi wrapped up 2024 with blazing speed and cloud-native SaaS magic. ✨ Don’t get stuck on Santa’s naughty list—switch to Totogi Charging-as-a-Service and unwrap the future today! 🎅 🎉 Curious about the highlights and what’s coming next? Here you go… 🎁✨
🎁 400+ Gifts Delivered: Over 400 production deployments this year—no downtime, no upgrades needed to access new features—just pure SaaS efficiency built on great engineering and AWS innovation.
🪄 CaaSmas Miracles: When Zain Sudan needed to urgently deploy a charging Disaster Recovery solution, Totogi responded in record time, activating the solution and migrating more than 20 million subscribers in just 18 days—showcasing the unheard of speed and flexibility of Charging-as-a-Service.
🎄New Presents Under the Tree: New pricing features support cool promotions and loyalty offerings to show customer love; faster and more flexible ways to integrate MVNOs reduce time to market; Fast Plan Migration allows virtually instantaneous plan changes for millions of customers.
🚀 What’s Coming in 2025: Get ready for Rate Anything that offers unprecedented flexibility to define innovative plans via our easy to use Plan Design tool and with no requirement for customization; deeper business insight through Advanced Dashboards supporting natural language queries; integrated Policy Management to more easily monetize quality of service for 5G standalone services including IOT, wearables and differentiated mobile data / content.
So don’t get caught on Santa’s naughty 👿 list with one of those creaking legacy chargers that are slow to innovate, complex and costly to operate, and an endless nightmare to upgrade. Come talk to us at Totogi and we’ll migrate you to Santa’s nice 😇 list with a CaaS trial that can be set up in hours.